
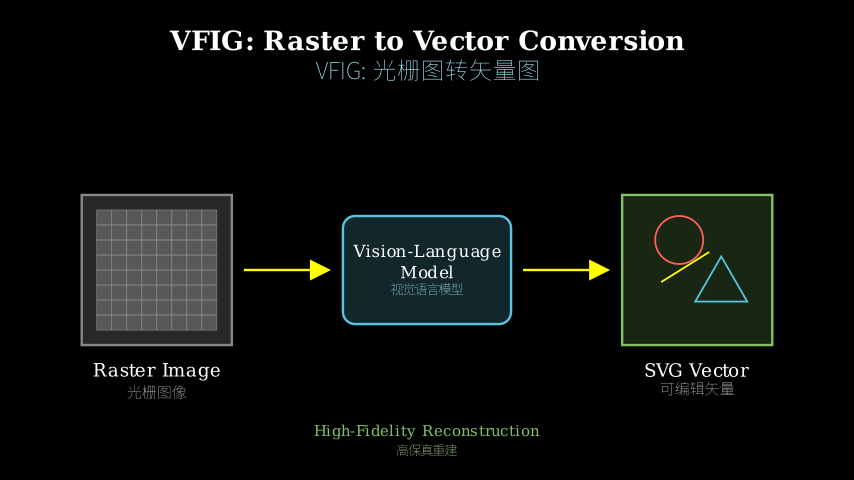
Paper: 2603.24575 Authors: Qijia He, Xunmei Liu, Hammaad Memon, Ziang Li, Zixian Ma, Jaemin Cho, Jason Ren, Daniel S Weld, Ranjay Krishna Categories: cs.CV, cs.AI
The Gap
Existing vectorization methods (Potrace, VTracer) work well for simple shapes but collapse on complex technical diagrams with nested structures, text annotations, and precise geometric relationships. Recent learning-based approaches (Im2Vec, DiffVG) either require ground-truth vector supervision that doesn’t exist at scale or produce outputs that lack semantic editability. The core problem: treating vectorization as pixel-level reconstruction misses the hierarchical compositional structure that makes SVG useful in the first place.
Problem: Rasterized figures → Lost editability
                |
                v
Prior approaches: Pixel-matching optimization
                |
                +---> Fails on complex diagrams
                +---> No semantic structure
                |
                v
This paper: Hierarchical structure learning
                |
                +---> Primitives first (SFT)
                +---> Global coherence (RL)
                |
                v
Evidence: 66K dataset + VFIG-BENCH metrics
                |
                v
Conclusion: Matches GPT-5.2 on complex figures
The Increment
One sentence: Before VFIG, you either manually redrew technical figures or got unusable vector outputs; after VFIG, you get editable SVG with preserved semantic structure from a single image.
Core Mechanism
VFIG operates in two stages. First, supervised fine-tuning teaches the model atomic SVG primitives (paths, circles, text) by training on isolated elements. The model learns to map visual features to SVG code tokens autoregressively, building a vocabulary of geometric operations. Second, reinforcement learning optimizes for global properties that supervised learning can’t capture: layout consistency across the entire diagram, topological correctness of connections, and visual fidelity measured by perceptual metrics.
The data pipeline is equally important. VFIG-DATA combines 66K figure-SVG pairs from two sources: real academic paper figures (scraped and filtered for quality) and procedurally generated diagrams (flowcharts, network graphs, technical schematics). The procedural generation ensures coverage of edge cases and compositional patterns that real data alone wouldn’t provide.
Input Image (PNG/JPEG)
        |
        v
   Vision Encoder
        |
        +---> Visual features
        |
        v
   Language Decoder (autoregressive)
        |
        +---> SVG tokens: <path d="M10,20 L30,40"/>
        |
        v
   Stage 1: SFT on primitives
        |     (circle, line, text → correct SVG)
        |
        v
   Stage 2: RL refinement
        |     Reward = layout + topology + fidelity
        |
        v
   Output: Editable SVG code
Think of VFIG like teaching someone to transcribe sheet music. First, you drill individual notes and symbols (supervised learning of primitives). The student learns “this squiggle means treble clef, that dot means staccato.” But knowing symbols doesn’t mean you can transcribe a Beethoven sonata—you need to understand phrasing, dynamics, how measures relate. That’s the RL phase: optimizing for musical coherence across the entire piece. The student gets feedback not on individual notes but on whether the transcription captures the composition’s structure. VFIG does the same: primitives first, then global diagram integrity.
Key Concepts
-
Coarse-to-fine curriculum: Start with easy examples (simple shapes, few elements) and gradually increase complexity (nested groups, overlapping objects, dense layouts). This prevents the model from getting stuck in local minima where it learns to copy pixels instead of understanding structure. It’s like learning to draw: you sketch rough shapes before adding details, not the other way around.
-
Reinforcement learning for structure: Supervised learning optimizes token-by-token prediction, but SVG quality depends on properties that span the entire output—does the flowchart’s arrow actually connect the right boxes? Are parallel lines truly parallel? RL uses a reward function that measures these global properties, letting the model explore variations and learn what “good diagram structure” means beyond pixel matching.
-
Procedural data augmentation: Real-world SVG-image pairs are scarce and biased toward certain diagram types. Procedural generation creates synthetic training data by programmatically building diagrams (random graph layouts, parameterized flowcharts) and rendering them. This gives the model exposure to compositional patterns and edge cases that real data doesn’t cover, like deeply nested groups or unusual geometric configurations.
Framework Shift
Before (pixel reconstruction):        After (structural decomposition):

Image → Optimize paths                Image → Parse hierarchy
  |       to match pixels               |       primitives + relations
  |                                     |
  +---> Local minima                    +---> Atomic elements (SFT)
  +---> No editability                  +---> Global coherence (RL)
  |                                     |
  v                                     v
Unusable vector soup                  Editable semantic SVG
From pixel-level optimization to hierarchical structure learning, the core shift is treating vectorization as compositional understanding rather than visual mimicry.
Expert Assessment
Problem choice: Real and underappreciated. The “lost source file” problem is endemic in academic publishing and technical documentation. Prior work focused on simple logos or handwriting, but complex diagrams are where the pain actually lives. This sits at the intersection of document understanding and generative modeling—a natural next step after OCR and layout analysis matured.
Method maturity: The two-stage curriculum is well-motivated, but the RL reward function feels hand-engineered. They use a weighted combination of perceptual loss, topology metrics, and layout consistency—each requiring manual tuning. A learned reward model (like RLHF) might generalize better. The procedural generation is clever but risks distribution mismatch: synthetic flowcharts don’t capture the idiosyncrasies of real hand-drawn diagrams.
Experimental integrity: Baselines are fair (Potrace, Im2Vec, GPT-4V), but the comparison with GPT-5.2 is murky—they don’t specify prompting strategy or whether GPT-5.2 was fine-tuned. VFIG-BENCH metrics are novel but not validated against human judgment at scale. The VLM-Judge score (0.829) is a proxy, not ground truth. I’d want to see inter-annotator agreement and failure case analysis.
Writing quality: The method section is dense—Figure 3 tries to show the entire pipeline but ends up cluttered. The ablation study (Table 3) is buried in the appendix when it should be front and center. The related work undersells how much this builds on recent VLM architectures (Flamingo, BLIP-2). Rewriting Section 4.2 to separate data curation from model training would clarify the contributions.
Verdict: weak accept — Solid execution on a real problem, but the method feels like careful engineering rather than a conceptual breakthrough. The dataset is the most reusable contribution.
Takeaways
The coarse-to-fine curriculum is immediately applicable to any structured generation task (code, markup, formal languages). Start with atomic elements, then optimize for global coherence—don’t try to learn both simultaneously. The procedural data generation strategy is also transferable: when real paired data is scarce, programmatically generate synthetic examples that cover compositional edge cases. Finally, the insight that RL can optimize structural properties that supervised learning misses applies beyond vectorization—think protein folding, circuit design, or any domain where local correctness doesn’t guarantee global validity.
论文: 2603.24575 作者: Qijia He, Xunmei Liu, Hammaad Memon, Ziang Li, Zixian Ma, Jaemin Cho, Jason Ren, Daniel S Weld, Ranjay Krishna 分类: cs.CV, cs.AI
缺口
现有矢量化方法(Potrace、VTracer)处理简单形状没问题,但遇到复杂技术图表就崩了——嵌套结构、文本标注、精确几何关系全都搞不定。
最近的学习方法(Im2Vec、DiffVG)要么需要大规模的真实矢量监督数据(根本不存在),要么输出的结果缺乏语义可编辑性。
核心问题在于:把矢量化当成像素级重建,完全忽略了让 SVG 真正有用的层次化组合结构。
问题: 栅格图 → 丧失可编辑性
        |
        v
旧方法: 像素匹配优化
        |
        +---> 复杂图表失效
        +---> 无语义结构
        |
        v
本文: 层次结构学习
        |
        +---> 先学基元 (SFT)
        +---> 再优化全局 (RL)
        |
        v
证据: 66K 数据集 + VFIG-BENCH 指标
        |
        v
结论: 复杂图表上媲美 GPT-5.2
增量
一句话: VFIG 之前,你要么手工重绘技术图表,要么得到无法使用的矢量输出;VFIG 之后,从一张图就能得到保留语义结构的可编辑 SVG。
核心机制
VFIG 分两阶段运作。
第一阶段是监督微调,教模型认识原子级 SVG 基元(路径、圆、文本),训练时用孤立元素。
模型学会把视觉特征自回归地映射成 SVG 代码 token,建立几何操作的词汇表。
第二阶段是强化学习,优化监督学习抓不到的全局属性:整张图的布局一致性、连接的拓扑正确性、用感知指标衡量的视觉保真度。
数据管线同样重要。
VFIG-DATA 组合了 66K 图表-SVG 对,来自两个源头:真实学术论文图表(爬取并过滤质量)和程序生成图表(流程图、网络图、技术示意图)。
程序生成确保覆盖边缘情况和组合模式,这些单靠真实数据搞不定。
输入图像 (PNG/JPEG)
        |
        v
   视觉编码器
        |
        +---> 视觉特征
        |
        v
   语言解码器 (自回归)
        |
        +---> SVG token: <path d="M10,20 L30,40"/>
        |
        v
   阶段1: 基元监督微调
        |     (圆、线、文本 → 正确 SVG)
        |
        v
   阶段2: 强化学习优化
        |     奖励 = 布局 + 拓扑 + 保真度
        |
        v
   输出: 可编辑 SVG 代码
把 VFIG 想象成教人抄乐谱。
先练单个音符和符号(监督学习基元)。
学生学会”这个弯钩是高音谱号,那个点是断奏”。
但认识符号不等于能抄贝多芬奏鸣曲——你得理解乐句、力度、小节之间的关系。
这就是强化学习阶段:优化整首曲子的音乐连贯性。
学生得到的反馈不是针对单个音符,而是抄写是否捕捉到了作品的结构。
VFIG 做的是同一件事:先学基元,再抓全局图表完整性。
关键概念
- 由粗到细的课程: 从简单例子开始(简单形状、少量元素),逐步增加复杂度(嵌套组、重叠对象、密集布局)。
这防止模型陷入局部最优——学会复制像素而不是理解结构。
就像学画画:先勾草图再加细节,不能反着来。
-
结构的强化学习: 监督学习优化逐 token 预测,但 SVG 质量取决于跨越整个输出的属性——流程图的箭头真的连对了框吗?平行线真的平行吗?强化学习用奖励函数衡量这些全局属性,让模型探索变体,学会什么叫”好的图表结构”,而不只是匹配像素。
-
程序化数据增强: 真实世界的 SVG-图像对稀缺且偏向某些图表类型。
程序生成通过编程构建图表(随机图布局、参数化流程图)并渲染,创造合成训练数据。
这让模型接触到真实数据覆盖不了的组合模式和边缘情况,比如深度嵌套组或不寻常的几何配置。
框架转变
之前(像素重建):                之后(结构分解):

图像 → 优化路径                  图像 → 解析层次
  |     匹配像素                    |     基元 + 关系
  |                                 |
  +---> 局部最优                    +---> 原子元素 (SFT)
  +---> 不可编辑                    +---> 全局连贯 (RL)
  |                                 |
  v                                 v
无用的矢量乱炖                    可编辑语义 SVG
从像素级优化到层次结构学习,核心转变是把矢量化当成组合理解而非视觉模仿。
专家评审
选题眼光: 真实且被低估的问题。
“源文件丢失”在学术出版和技术文档里到处都是。
之前的工作聚焦简单 logo 或手写体,但复杂图表才是真正的痛点。
这处在文档理解和生成建模的交叉点——OCR 和布局分析成熟后的自然下一步。
方法成熟度: 两阶段课程动机充分,但强化学习奖励函数感觉是手工设计的。
他们用感知损失、拓扑指标、布局一致性的加权组合——每个都需要手动调参。
学习出来的奖励模型(像 RLHF)可能泛化更好。
程序生成很聪明,但有分布不匹配的风险:合成流程图捕捉不到真实手绘图的特质。
实验诚意: 基线公平(Potrace、Im2Vec、GPT-4V),但和 GPT-5.2 的比较含糊——没说提示策略,也没说 GPT-5.2 是否微调过。
VFIG-BENCH 指标新颖但没大规模验证人类判断。
VLM-Judge 分数(0.829)是代理,不是真值。
我想看标注者间一致性和失败案例分析。
写作功力: 方法部分太密——图 3 想展示整个流程结果搞得很乱。
消融研究(表 3)埋在附录里,本该放正文显眼位置。
相关工作低估了这篇文章在多大程度上建立在最近的 VLM 架构上(Flamingo、BLIP-2)。
重写 4.2 节,把数据整理和模型训练分开,能让贡献更清晰。
判决: 弱接收 — 真实问题上的扎实执行,但方法感觉像精心工程而非概念突破。
数据集是最可复用的贡献。
要点总结
由粗到细的课程立刻适用于任何结构化生成任务(代码、标记语言、形式语言)。
先学原子元素,再优化全局连贯性——别想同时学两者。
程序化数据生成策略也可迁移:真实配对数据稀缺时,编程生成覆盖组合边缘情况的合成样本。
最后,强化学习能优化监督学习漏掉的结构属性这个洞见,超越了矢量化——想想蛋白质折叠、电路设计,或任何局部正确不保证全局有效的领域。