Paper: 2604.28167 Authors: Grace T. Bai, Brandon B. Le Categories: cond-mat.soft, cs.LG
The Gap
The Vicsek model describes how birds flock, fish school, and particles self-organize. We know it has an ordered phase (everyone moves together) and a disordered phase (random motion). But the model has three control knobs: noise strength (η), density (ρ), and speed (v₀). Prior work mapped phase boundaries in 2D slices—fix one parameter, vary the other two. No one had systematically mapped the full 3D parameter space or identified whether there’s a coexistence region where order and disorder mix.
The problem: running simulations across a 3D grid is expensive, and hand-labeling phases from raw trajectories doesn’t scale. You need a way to turn sparse simulation data into a complete phase diagram.
Problem: 3D phase space unmapped
   |
   v
Assumption: Dynamical observables cluster by phase
   |
   v
Method: K-Means on observables → NN classifier
   |
   v
Evidence: 0.92 accuracy, coexistence region found
   |
   v
Conclusion: Sparse sims → global phase map
The Increment
One sentence: Before this paper, we had 2D slices of the Vicsek phase diagram; after, we have a 3D map with a resolved coexistence region and a trained classifier that interpolates between simulation points.
Core Mechanism
The method has three stages. First, run Vicsek simulations at scattered points in (η, ρ, v₀) space. For each simulation, wait for the system to settle, then measure long-time observables: polarization (how aligned particles are), density fluctuations, velocity correlations. These observables are the fingerprint of each phase.
Second, feed these fingerprints into K-Means clustering with K=3. The algorithm groups simulation points into three clusters without knowing what “order” or “disorder” means—it just finds natural groupings in observable space. The authors then inspect each cluster and label them: one cluster has high polarization (ordered), one has low polarization (disordered), one sits in between (coexistence).
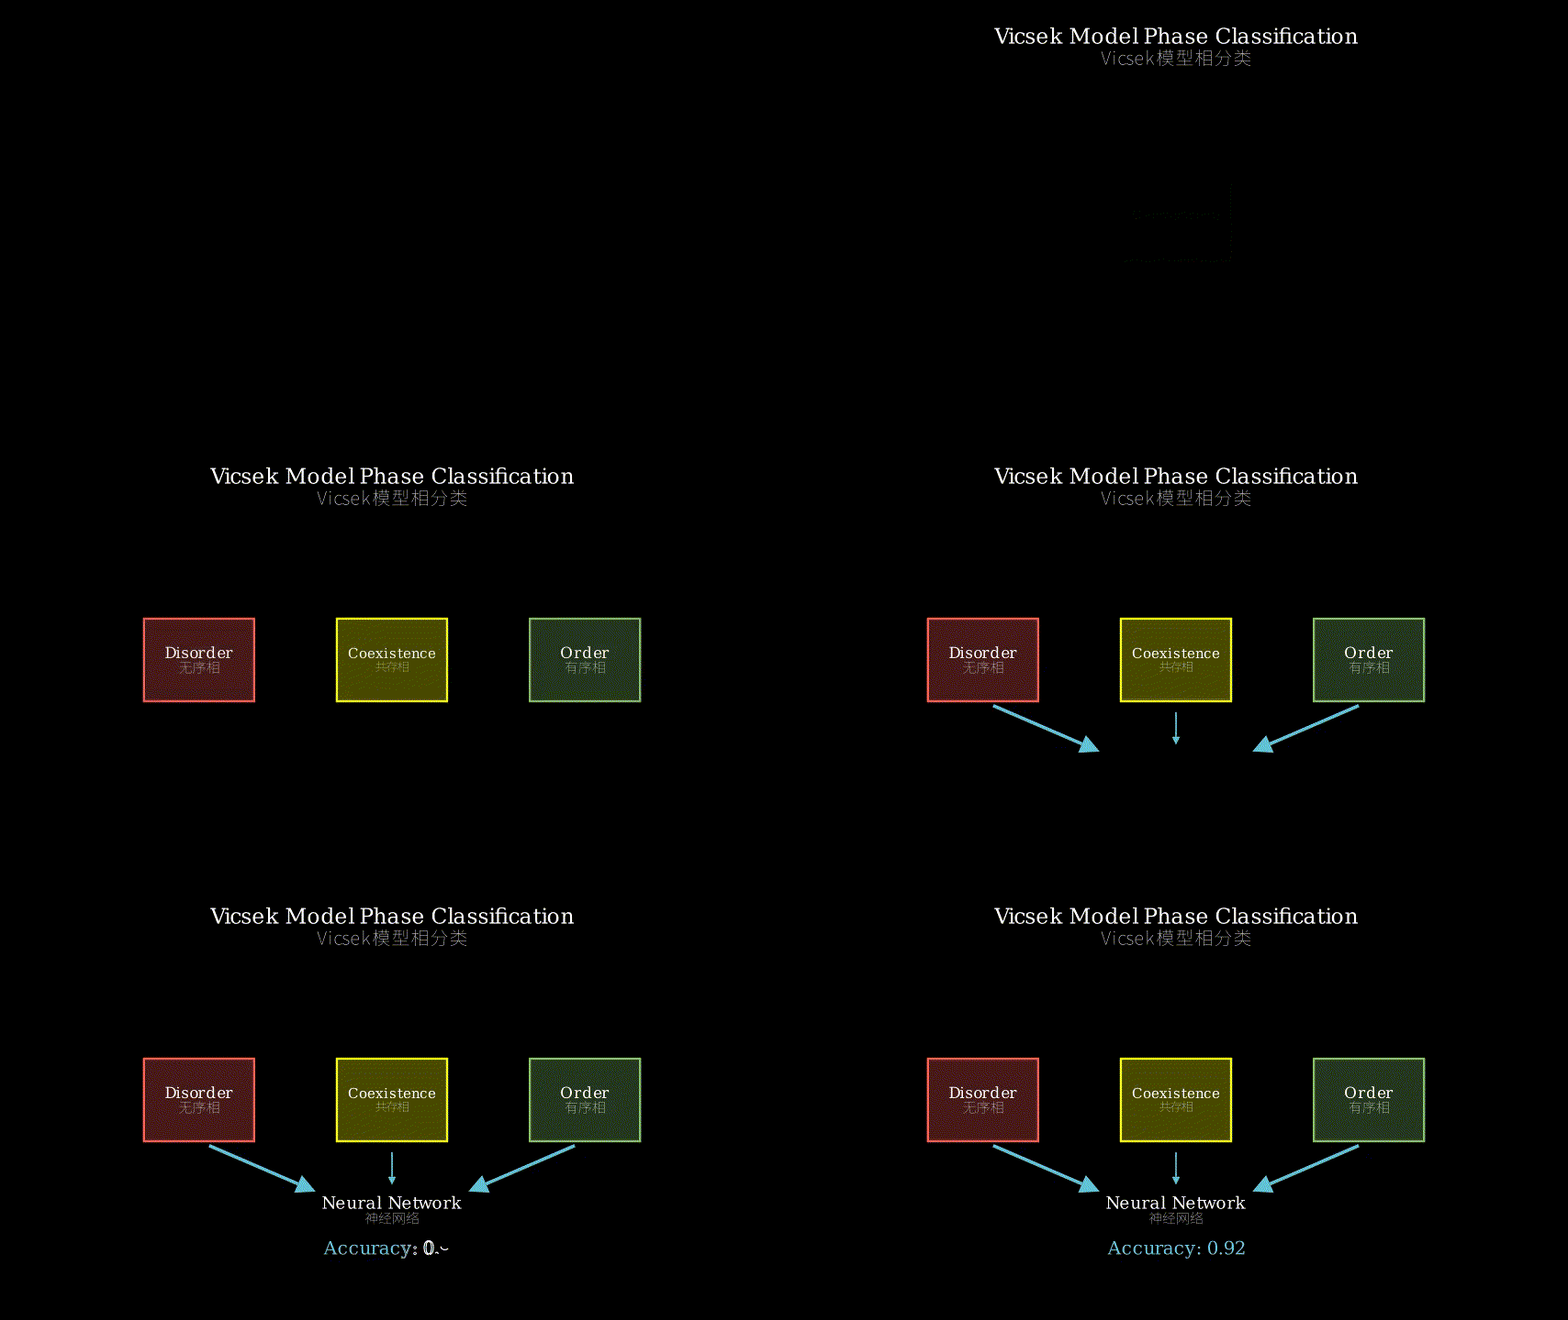
Third, train a neural network to predict cluster labels from raw parameters (η, ρ, v₀). The network learns the mapping from control knobs to phase. Once trained, you can query it at any point in parameter space, even where you never ran a simulation. This fills in the gaps and produces a continuous phase diagram.
Simulation grid (sparse)
   |
   v
[Observables: polarization, density fluct, etc.]
   |
   v
K-Means (K=3) --> [Cluster 0: disorder]
                  [Cluster 1: order]
                  [Cluster 2: coexistence]
   |
   v
Neural Network: (η,ρ,v₀) --> phase label
   |
   v
Query anywhere --> interpolated phase map
Think of it like tasting wine. You can’t taste every bottle in a vineyard, so you sample a few dozen. For each bottle, you measure tannin, acidity, sweetness—the observables. Then you group bottles by taste profile using clustering: “this group is fruity, this group is dry, this group is balanced.” Finally, you train a sommelier (the neural network) to predict taste profile from the vineyard location and grape variety. Now the sommelier can tell you what any bottle will taste like, even ones you never opened.
Key Concepts
-
Vicsek model: Imagine a swarm of drones. Each drone looks at its neighbors within some radius, averages their heading directions, adds a bit of random noise, and flies in that new direction. If noise is low and drones are packed tight, they align and move as a flock. If noise is high or drones are sparse, they wander randomly. The model has three knobs: η (noise strength), ρ (how many drones per unit area), v₀ (how fast they fly). The question is: for any setting of these knobs, does the swarm flock or scatter?
-
Coexistence phase: In some parameter regions, the system can’t decide. It’s like water at its boiling point—liquid and vapor coexist. Here, patches of aligned particles drift through a disordered background, or vice versa. The system fluctuates between order and disorder over time. This phase is narrow and hard to spot without fine-grained sampling.
-
K-Means clustering: You have a cloud of data points in high-dimensional space (here, each point is a simulation characterized by its observables). K-Means finds K cluster centers and assigns each point to the nearest center. It’s like dropping K magnets into the cloud and letting each point snap to the closest magnet. The algorithm iterates: move magnets to the average position of their attracted points, reassign points, repeat until stable. No labels needed—structure emerges from geometry alone.
Framework Shift
Before (manual 2D slices):          After (ML-driven 3D map):

  Fix v₀, scan (η,ρ)                 Sample sparse (η,ρ,v₀) grid
       |                                      |
       v                                      v
  Run sims, eyeball phases           Compute observables
       |                                      |
       v                                      v
  Draw boundary by hand              K-Means auto-labels
       |                                      |
       v                                      v
  Repeat for next v₀ slice           NN interpolates everywhere
       |                                      |
       v                                      v
  Stack slices → incomplete 3D       Continuous 3D phase diagram
From manual slice-and-stack to automated sample-cluster-interpolate, the core shift is replacing human pattern recognition with unsupervised learning that scales to higher dimensions.
Expert Assessment
Problem choice: Real gap. The Vicsek model is a workhorse in active matter, and its 3D phase structure was genuinely unknown. The coexistence region is not just a curiosity—it’s where interesting physics happens (nucleation, phase separation dynamics). This sits squarely in the field’s trajectory toward understanding collective motion in realistic parameter regimes.
Method maturity: Solid but not groundbreaking. K-Means is the simplest clustering algorithm; more sophisticated methods (DBSCAN, Gaussian mixtures) might handle noisy boundaries better. The neural network is a black box—no physics insight, just interpolation. A simpler approach might be fitting analytic functions to the cluster boundaries, which would give you equations instead of a trained model. But for a first pass at a 3D map, this is pragmatic.
Experimental integrity: Baselines are fair—they compare to known 2D results and show consistency. The 0.92 accuracy is respectable but not bulletproof; 8% misclassification near phase boundaries is expected, but they don’t quantify uncertainty or show where the classifier is confused. The coexistence region is narrow, and I’d want to see more validation that it’s real and not an artifact of finite simulation time or K-Means splitting a single phase.
Writing quality: The paper is clear but rushed. The methods section glosses over hyperparameters (network architecture, training details, K-Means initialization). The results section shows the phase map but doesn’t deeply analyze the coexistence region—what are its dynamical signatures? How does it connect to known phase transition theory? Rewriting the discussion to engage with active matter literature would elevate this from a methods demo to a physics contribution.
Verdict: weak accept — useful contribution to the Vicsek literature, but the ML is off-the-shelf and the physics analysis is shallow.
Takeaways
If you’re mapping phase diagrams in any high-dimensional parameter space (chemical reactions, neural network training dynamics, economic models), steal this workflow: sample sparsely, compute summary statistics (observables), cluster to find natural groupings, train a cheap classifier to interpolate. The key insight is that you don’t need dense sampling everywhere—just enough to anchor the clusters, then let the classifier fill in the gaps.
Also, K-Means as a phase labeler is underused. If you have unlabeled simulation data and suspect distinct regimes, clustering on observables is faster than hand-labeling and often reveals structure you’d miss by eye. Just remember: K-Means assumes spherical clusters, so if your phases have weird shapes in observable space, you’ll need something more flexible.
论文: 2604.28167 作者: Grace T. Bai, Brandon B. Le 分类: cond-mat.soft, cs.LG
缺口
Vicsek 模型描述鸟群如何成群、鱼群如何游动、粒子如何自组织。
我们知道它有有序相(所有个体一起运动)和无序相(随机运动)。
但模型有三个控制旋钮:噪声强度(η)、密度(ρ)、速度(v₀)。
此前的工作绘制了二维切片中的相边界——固定一个参数,改变另外两个。
没人系统地绘制过完整的三维参数空间,也没人确认是否存在有序与无序混合的共存区。
问题在于:在三维网格上运行模拟很昂贵,从原始轨迹手工标注相态也不可扩展。
你需要一种方法把稀疏的模拟数据转化为完整的相图。
问题:三维相空间未被绘制
   |
   v
假设:动力学观测量按相态聚类
   |
   v
方法:观测量上做 K-Means → 神经网络分类器
   |
   v
证据:0.92 准确率,发现共存区
   |
   v
结论:稀疏模拟 → 全局相图
增量
一句话: 这篇论文之前,我们有 Vicsek 相图的二维切片;之后,我们有了三维地图,解析出共存区,还有一个能在模拟点之间插值的训练好的分类器。
核心机制
方法分三个阶段。
首先,在(η, ρ, v₀)空间的分散点上运行 Vicsek 模拟。
对每个模拟,等系统稳定下来,然后测量长时观测量:极化度(粒子对齐程度)、密度涨落、速度关联。
这些观测量是每个相态的指纹。
第二,把这些指纹喂给 K=3 的 K-Means 聚类。
算法在不知道”有序”或”无序”含义的情况下,把模拟点分成三个簇——它只是在观测量空间中找自然分组。
作者然后检查每个簇并标注:一个簇极化度高(有序),一个极化度低(无序),一个介于中间(共存)。
第三,训练神经网络从原始参数(η, ρ, v₀)预测簇标签。
网络学习从控制旋钮到相态的映射。
训练完成后,你可以在参数空间的任何点查询它,即使那里从未运行过模拟。
这填补了空白,产生连续的相图。
模拟网格(稀疏)
   |
   v
[观测量:极化度、密度涨落等]
   |
   v
K-Means (K=3) --> [簇0:无序]
                  [簇1:有序]
                  [簇2:共存]
   |
   v
神经网络:(η,ρ,v₀) --> 相态标签
   |
   v
任意点查询 --> 插值相图
把它想象成品酒。
你不可能尝遍葡萄园的每瓶酒,所以你采样几十瓶。
对每瓶酒,你测量单宁、酸度、甜度——观测量。
然后你用聚类按口味特征分组:“这组果味重,这组干涩,这组平衡”。
最后你训练一个侍酒师(神经网络)从葡萄园位置和葡萄品种预测口味特征。
现在侍酒师能告诉你任何一瓶酒的味道,即使是你从未开过的。
关键概念
- Vicsek 模型: 想象一群无人机。
每架无人机看某个半径内的邻居,平均它们的航向,加一点随机噪声,然后朝新方向飞。
如果噪声低且无人机密集,它们会对齐并作为群体移动。
如果噪声高或无人机稀疏,它们会随机游荡。
模型有三个旋钮:η(噪声强度)、ρ(单位面积有多少无人机)、v₀(飞行速度)。
问题是:对这些旋钮的任何设置,群体是成群还是散开?
- 共存相: 在某些参数区域,系统无法决定。
就像水在沸点——液体和蒸汽共存。
这里,对齐粒子的斑块在无序背景中漂移,或反之。
系统随时间在有序和无序之间波动。
这个相态很窄,没有细粒度采样很难发现。
- K-Means 聚类: 你在高维空间有一团数据点(这里每个点是一个由观测量刻画的模拟)。
K-Means 找 K 个簇中心,把每个点分配给最近的中心。
就像往云里扔 K 块磁铁,让每个点吸附到最近的磁铁。
算法迭代:把磁铁移到被吸引点的平均位置,重新分配点,重复直到稳定。
不需要标签——结构从几何中自然涌现。
框架转变
之前(手工二维切片):              之后(机器学习驱动的三维地图):

  固定 v₀,扫描(η,ρ)                采样稀疏(η,ρ,v₀)网格
       |                                    |
       v                                    v
  运行模拟,目测相态                  计算观测量
       |                                    |
       v                                    v
  手工画边界                          K-Means 自动标注
       |                                    |
       v                                    v
  对下一个 v₀ 切片重复                神经网络到处插值
       |                                    |
       v                                    v
  堆叠切片 → 不完整三维              连续三维相图
从手工切片堆叠到自动采样-聚类-插值,核心转变是用无监督学习替代人类模式识别,能扩展到更高维度。
专家评审
选题眼光: 真缺口。
Vicsek 模型是活性物质领域的主力模型,其三维相结构确实未知。
共存区不只是好奇心——那里发生有趣的物理(成核、相分离动力学)。
这正处于该领域理解现实参数区间中集体运动的发展轨迹上。
方法成熟度: 扎实但不突破。
K-Means 是最简单的聚类算法;更复杂的方法(DBSCAN、高斯混合)可能更好地处理噪声边界。
神经网络是黑箱——没有物理洞见,只是插值。
更简单的方法可能是对簇边界拟合解析函数,这会给你方程而不是训练好的模型。
但作为三维地图的首次尝试,这很务实。
实验诚意: 基线公平——他们与已知的二维结果比较并显示一致性。
0.92 准确率可敬但不是铁证;相边界附近 8% 的误分类是预期的,但他们没有量化不确定性或显示分类器在哪里困惑。
共存区很窄,我想看更多验证证明它是真实的,而不是有限模拟时间或 K-Means 分裂单一相态的伪影。
写作功力: 清晰但仓促。
方法部分略过超参数(网络架构、训练细节、K-Means 初始化)。
结果部分展示相图但没有深入分析共存区——它的动力学特征是什么?
它如何与已知的相变理论联系?
重写讨论部分以与活性物质文献对话,会把这篇论文从方法演示提升为物理贡献。
判决: 弱接收 — 对 Vicsek 文献有用的贡献,但机器学习是现成的,物理分析浅薄。
要点总结
如果你在任何高维参数空间(化学反应、神经网络训练动力学、经济模型)绘制相图,偷这个工作流:稀疏采样,计算汇总统计量(观测量),聚类找自然分组,训练便宜的分类器插值。
关键洞见是你不需要到处密集采样——只需足够锚定簇,然后让分类器填补空白。
另外,K-Means 作为相态标注器被低估了。
如果你有未标注的模拟数据并怀疑存在不同区间,在观测量上聚类比手工标注快,常常揭示你目测会错过的结构。
只要记住:K-Means 假设球形簇,所以如果你的相态在观测量空间有奇怪形状,你需要更灵活的东西。