Paper: 2604.04916 Authors: Xuyang Shen, Zijie Pan, Diego Cerrai, Xinxuan Zhang, Christopher Colorio, Emmanouil N. Anagnostou, Dongjin Song Categories: cs.LG
The Gap
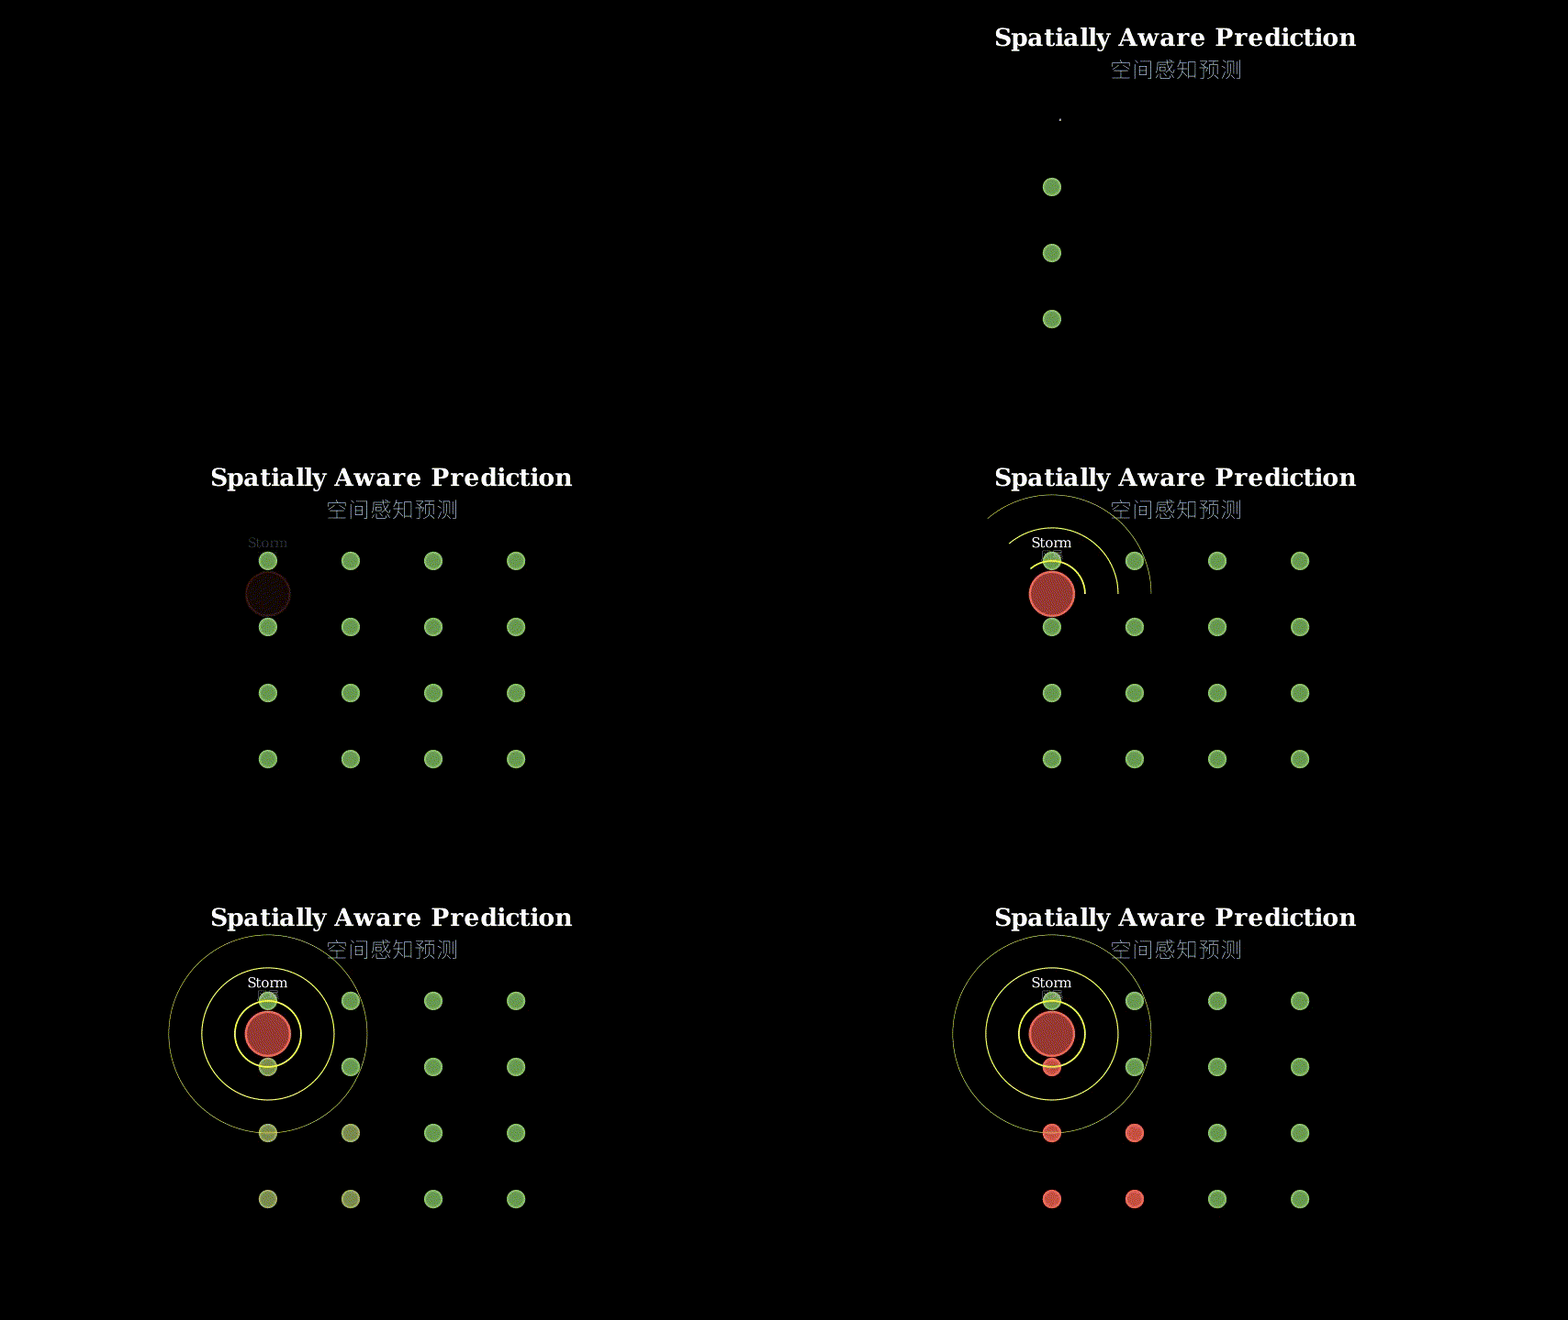
Existing power outage prediction systems treat each location independently, ignoring that storms don’t respect grid boundaries. When a hurricane hits Connecticut, the wind doesn’t stop at town lines—it cascades across regions, knocking out power in spatial patterns. Prior models (like the UConn-Eversource OPM system) use tabular features per location but miss this spatial dependency. They also struggle with class imbalance: hurricanes are rare but devastating, while ice storms are common but localized. The result? Models overfit to frequent events and fail on the rare-but-critical ones.
Problem: Outages spread spatially, events vary in frequency
    |
    v
Assumption: Spatial graph + contrastive learning can capture both
    |
    v
Method: SA-HGNN (spatial encoding) + contrastive loss (event balance)
    |
    v
Evidence: SOTA on 4 territories, handles rare events better
    |
    v
Conclusion: Spatial awareness + event-level embeddings improve prediction
The Increment
One sentence: Before, outage models treated locations as isolated points; now they understand that geography matters and rare events need special attention.
Core Mechanism
SA-HGNN has three stages. First, it builds two graphs: a static graph connecting locations by infrastructure (power lines, land cover) and a dynamic graph connecting them by weather similarity (wind speed, precipitation). Second, it runs separate graph neural networks on each, then fuses their embeddings. Third, it applies contrastive learning: for each weather event type (hurricane, ice storm, etc.), it pulls together embeddings of locations that behave similarly during that event, while pushing apart embeddings across different event types.
Input: Location features (static + dynamic weather)
  |
  v
[Static Graph GNN] ---> Static embeddings
  |                              |
  |                              v
[Dynamic Graph GNN] --> Dynamic embeddings
  |                              |
  +------------------------------+
                |
                v
         [Fusion Layer]
                |
                v
         Fused embeddings
                |
                v
    [Contrastive Learning]
    (Pull similar locations together per event,
     push different events apart)
                |
                v
    Location-specific embeddings
                |
                v
         [Classifier]
                |
                v
    Outage prediction (0-4 levels)
Think of it like a weather forecaster who’s also a city planner. The static graph is the city map—it knows which neighborhoods share power substations, which areas have tree cover that might fall on lines. The dynamic graph is the live weather radar—it sees which zones are getting hit by the same wind gust right now. The forecaster looks at both maps simultaneously, overlaying them to predict where outages will cascade. But here’s the trick: the forecaster has a mental model for each disaster type. When they see a hurricane pattern, they recall “last time this happened, coastal areas went dark first, then inland.” That’s the contrastive learning—building event-specific intuition so rare disasters aren’t treated like common ones.
Key Concepts
-
Hybrid Graph Construction: Most GNNs use one graph. This paper uses two because infrastructure and weather operate on different timescales. Static features (power lines, land cover) change slowly; dynamic features (wind, rain) change hourly. By separating them into two graphs, the model can learn different aggregation patterns: static graphs use fixed connectivity (e.g., “these towns share a substation”), while dynamic graphs use weather-based similarity (e.g., “these locations are experiencing similar wind speeds right now”). The fusion layer then combines both perspectives before prediction.
-
Contrastive Learning for Event Imbalance: Standard classification treats all training samples equally. But if you have 1000 ice storm examples and 10 hurricane examples, the model learns to predict ice storms well and ignores hurricanes. Contrastive learning fixes this by creating a separate embedding space per event type. During training, for each event (e.g., Hurricane Sandy), it pulls together embeddings of all locations affected by that event, regardless of how many samples exist. This forces the model to learn event-specific patterns even from rare occurrences. It’s like giving each disaster type its own chapter in the model’s memory, so rare events aren’t drowned out by common ones.
-
Spatially Aware Aggregation: Traditional GNNs aggregate neighbor features uniformly. SA-HGNN weights neighbors by spatial distance and feature similarity. If two locations are 50 miles apart but experiencing identical wind speeds, they should influence each other more than two locations 5 miles apart with different weather. The model learns these weights during training, effectively discovering which spatial scales matter for outage propagation (e.g., hurricanes affect 100+ mile radii, ice storms affect 10-mile radii).
Framework Shift
Before (mainstream approach):        After (this paper):

Location A --> [Features] --> Model  Location A ---+
Location B --> [Features] --> Model               |
Location C --> [Features] --> Model      [Static Graph GNN]
(Independent predictions)                         |
                                                   v
                                          Static embeddings
                                                   |
                                                   +---> [Fusion]
                                                   |         |
                                          Dynamic embeddings v
                                                   ^    [Contrastive]
                                                   |         |
                                      [Dynamic Graph GNN]   v
                                                   |    Predictions
Weather at A ---+                                  |
Weather at B ---+                                  |
Weather at C ---+                                  |
(Spatial relationships ignored)    (Spatial + event-aware)
From isolated feature vectors to spatially-connected graphs with event-specific embeddings, the core shift is treating outage prediction as a spatial propagation problem rather than a per-location classification task.
Expert Assessment
Problem choice: Real gap. Existing OPM systems are deployed in production but genuinely miss spatial effects—this isn’t academic navel-gazing. The UConn-Eversource partnership gives access to actual utility data, which is rare in this domain. The problem sits at the intersection of graph learning and imbalanced classification, both active areas.
Method maturity: Solid engineering, not groundbreaking theory. Hybrid graphs are known (e.g., heterogeneous GNNs), contrastive learning for imbalance is established (e.g., supervised contrastive loss). The novelty is in the combination and domain application. The spatial weighting mechanism is clever but not deeply analyzed—why this aggregation function over others? The paper doesn’t ablate design choices rigorously.
Experimental integrity: Baselines are fair (XGBoost, standard GNN, temporal models). Four territories provide good generalization evidence. However, the evaluation metric (macro F1) hides class-specific performance—I’d want to see per-event-type confusion matrices. The contrastive learning ablation (Table 3) shows clear gains, but the paper doesn’t explain *why it works better for rare events beyond intuition. Also, no discussion of computational cost—GNNs on large graphs can be expensive for real-time prediction.
Writing quality: The method section is dense and assumes GNN familiarity. Figure 2 (architecture diagram) is cluttered—splitting it into separate static/dynamic/fusion diagrams would help. The related work section is thorough but reads like a literature dump. The results section is strong, with good visualizations (Figure 4’s spatial heatmaps are excellent). If I could rewrite one section, it’d be the method—walk through a concrete example (e.g., “Hurricane Sandy hits location X, here’s how SA-HGNN processes it step-by-step”) before diving into formalism.
Verdict: weak accept — Solid applied work with real-world impact, but incremental methodologically. The spatial awareness is the key contribution; contrastive learning is a known trick applied competently. Worth publishing for the domain contribution and empirical validation, but not a methodological leap.
Takeaways
Hybrid graphs for multi-timescale data: If your problem has both slow-changing structure (e.g., road networks, social connections) and fast-changing signals (e.g., traffic, messages), don’t force them into one graph. Build separate graphs, run separate GNNs, fuse late. This applies beyond power grids—think epidemic modeling (static: contact networks, dynamic: mobility patterns) or financial networks (static: ownership, dynamic: transaction flows).
Contrastive learning as a class balancing tool: Instead of reweighting loss functions or oversampling rare classes, use contrastive learning to create event-specific embedding spaces. This is especially useful when rare classes have distinct patterns (e.g., hurricanes vs. ice storms) rather than just being underrepresented versions of common classes. The key: define positive pairs within each class, negative pairs across classes.
Spatial weighting in GNNs: Don’t assume uniform neighbor influence. Learn attention weights based on both distance and feature similarity. This is underused in GNN applications—most papers either use fixed adjacency or pure attention without spatial priors. The trick: initialize attention with distance-based bias, then let the model refine it.
论文: 2604.04916 作者: Xuyang Shen, Zijie Pan, Diego Cerrai, Xinxuan Zhang, Christopher Colorio, Emmanouil N. Anagnostou, Dongjin Song 分类: cs.LG
缺口
现有的停电预测系统把每个地点当作独立个体,忽略了风暴不会在电网边界停下的事实。
当飓风袭击康涅狄格州时,风不会在镇界停住——它会跨区域级联,按空间模式击倒电力。
之前的模型(如康涅狄格大学-Eversource的OPM系统)对每个地点使用表格特征,但遗漏了这种空间依赖性。
它们还面临类别不平衡问题:飓风罕见但破坏性强,冰暴常见但局部化。
结果?模型过拟合频繁事件,在罕见但关键的事件上失效。
问题:停电空间传播,事件频率差异大
    |
    v
假设:空间图+对比学习可同时捕获两者
    |
    v
方法:SA-HGNN(空间编码)+对比损失(事件平衡)
    |
    v
证据:4个服务区域SOTA,更好处理罕见事件
    |
    v
结论:空间感知+事件级嵌入改进预测
增量
一句话: 之前停电模型把地点当孤立点;现在它们理解地理很重要,罕见事件需要特殊关注。
核心机制
SA-HGNN有三个阶段。
首先,它构建两个图:静态图通过基础设施(电线、土地覆盖)连接地点,动态图通过天气相似性(风速、降水)连接它们。
其次,它在每个图上运行独立的图神经网络,然后融合它们的嵌入。
第三,它应用对比学习:对每种天气事件类型(飓风、冰暴等),它把该事件期间行为相似的地点的嵌入拉到一起,同时把不同事件类型的嵌入推开。
输入:地点特征(静态+动态天气)
  |
  v
[静态图GNN] ---> 静态嵌入
  |                    |
  |                    v
[动态图GNN] --> 动态嵌入
  |                    |
  +--------------------+
            |
            v
      [融合层]
            |
            v
      融合嵌入
            |
            v
   [对比学习]
   (同事件内相似地点拉近,
    不同事件间推远)
            |
            v
   地点特定嵌入
            |
            v
      [分类器]
            |
            v
   停电预测(0-4级)
把它想象成一个既是气象预报员又是城市规划师的人。
静态图是城市地图——它知道哪些社区共享变电站,哪些区域有可能倒在线路上的树木覆盖。
动态图是实时气象雷达——它看到哪些区域现在正被同一阵风击中。
预报员同时看两张地图,叠加它们来预测停电会在哪里级联。
但这里有个诀窍:预报员对每种灾害类型都有心理模型。
当他们看到飓风模式时,会回忆”上次这种情况,沿海地区先断电,然后是内陆”。
这就是对比学习——建立事件特定的直觉,让罕见灾害不会被当作常见灾害处理。
关键概念
- 混合图构建: 大多数GNN使用一个图。
这篇论文使用两个,因为基础设施和天气在不同时间尺度上运作。
静态特征(电线、土地覆盖)变化缓慢;动态特征(风、雨)每小时变化。
通过把它们分成两个图,模型可以学习不同的聚合模式:静态图使用固定连接(例如”这些城镇共享一个变电站”),而动态图使用基于天气的相似性(例如”这些地点现在正经历相似的风速”)。
然后融合层在预测前结合两种视角。
- 用于事件不平衡的对比学习: 标准分类平等对待所有训练样本。
但如果你有1000个冰暴样本和10个飓风样本,模型会学会很好地预测冰暴而忽略飓风。
对比学习通过为每种事件类型创建单独的嵌入空间来解决这个问题。
在训练期间,对于每个事件(例如飓风桑迪),它把该事件影响的所有地点的嵌入拉到一起,无论存在多少样本。
这迫使模型即使从罕见事件中也能学习事件特定的模式。
这就像在模型的记忆中给每种灾害类型单独一章,这样罕见事件就不会被常见事件淹没。
- 空间感知聚合: 传统GNN均匀聚合邻居特征。
SA-HGNN根据空间距离和特征相似性对邻居加权。
如果两个地点相距50英里但经历相同的风速,它们应该比相距5英里但天气不同的两个地点更相互影响。
模型在训练期间学习这些权重,有效地发现哪些空间尺度对停电传播重要(例如飓风影响100+英里半径,冰暴影响10英里半径)。
框架转变
之前(主流方法):              之后(本文方法):

地点A --> [特征] --> 模型    地点A ---+
地点B --> [特征] --> 模型             |
地点C --> [特征] --> 模型    [静态图GNN]
(独立预测)                            |
                                      v
                             静态嵌入
                                      |
                                      +---> [融合]
                                      |        |
                             动态嵌入          v
                                      ^   [对比学习]
                                      |        |
                         [动态图GNN]          v
                                      |    预测
地点A天气 ---+                        |
地点B天气 ---+                        |
地点C天气 ---+                        |
(忽略空间关系)         (空间+事件感知)
从孤立的特征向量到空间连接的图与事件特定嵌入,核心转变是把停电预测当作空间传播问题而非每地点分类任务。
专家评审
选题眼光: 真实缺口。
现有OPM系统已在生产中部署但确实遗漏了空间效应——这不是学术自娱自乐。
康涅狄格大学-Eversource合作提供了实际公用事业数据访问,这在该领域很罕见。
问题位于图学习和不平衡分类的交叉点,两者都是活跃领域。
方法成熟度: 扎实的工程,不是突破性理论。
混合图是已知的(例如异构GNN),用于不平衡的对比学习已确立(例如监督对比损失)。
新颖性在于组合和领域应用。
空间加权机制很巧妙但没有深入分析——为什么用这个聚合函数而不是其他?论文没有严格消融设计选择。
实验诚意: 基线公平(XGBoost、标准GNN、时序模型)。
四个服务区域提供了良好的泛化证据。
然而,评估指标(宏F1)隐藏了类别特定性能——我想看每事件类型的混淆矩阵。
对比学习消融(表3)显示明显增益,但论文没有解释为什么它对罕见事件效果更好,只有直觉。
此外,没有讨论计算成本——大图上的GNN对实时预测可能很昂贵。
写作功力: 方法部分密集,假设读者熟悉GNN。
图2(架构图)杂乱——把它分成独立的静态/动态/融合图会有帮助。
相关工作部分很全面但读起来像文献堆砌。
结果部分很强,有很好的可视化(图4的空间热图很出色)。
如果我能重写一个部分,会是方法——在深入形式化之前,先走一遍具体例子(例如”飓风桑迪袭击地点X,这是SA-HGNN如何逐步处理它”)。
判决: 弱接收 — 扎实的应用工作,有实际影响,但方法论上是增量式的。
空间感知是关键贡献;对比学习是已知技巧的称职应用。
值得发表是因为领域贡献和实证验证,但不是方法论飞跃。
要点总结
多时间尺度数据的混合图: 如果你的问题既有缓慢变化的结构(例如道路网络、社交连接)又有快速变化的信号(例如交通、消息),不要强行把它们放进一个图。
构建独立的图,运行独立的GNN,后期融合。
这适用于电网之外——想想流行病建模(静态:接触网络,动态:移动模式)或金融网络(静态:所有权,动态:交易流)。
对比学习作为类别平衡工具: 与其重新加权损失函数或过采样罕见类别,不如使用对比学习创建事件特定的嵌入空间。
这在罕见类别有独特模式(例如飓风vs冰暴)而不仅仅是常见类别的代表不足版本时特别有用。
关键:在每个类别内定义正对,跨类别定义负对。
GNN中的空间加权: 不要假设邻居影响均匀。
基于距离和特征相似性学习注意力权重。
这在GNN应用中使用不足——大多数论文要么使用固定邻接,要么使用没有空间先验的纯注意力。
诀窍:用基于距离的偏置初始化注意力,然后让模型细化它。