Paper: 2606.11176 Authors: Kevin Qinghong Lin, Batu EI, Yuhong Shi, Pan Lu, Philip Torr, James Zou Categories: cs.CV, cs.CL, cs.CY, cs.HC
The Gap
Data-driven journalism today is fragmented. You have data-science agents (e.g., Code Interpreter, AutoGen) that run statistics and answer specific queries – but they produce code snippets and tables, not a coherent narrative. On the other side, design agents (e.g., WebSim, Midjourney) can generate beautiful static charts or splash pages, but they have no understanding of data provenance or editorial angle. The missing piece is an end-to-end system that takes raw data, finds an angle, writes a story, produces interactive visuals, and – crucially – ties every claim back to its source so a reader (or fact-checker) can verify it. This paper fills that gap by orchestrating multiple specialized LLM agents into a virtual newsroom, with an explicit focus on verifiability and multimodal output.
           Problem: Fragmented tools, no end-to-end data storytelling
                     |
                     v
          Assumption: An agent can replace a human newsroom team
                     |
                     v
          Method: Multi-agent framework (Data2Story) with Inspector
                     |
                     v
       Evidence: 18 articles compared on angle coverage, rubric eval
                 (53 participants), proxy judge cost, verifiability
                     |
                     v
       Conclusion: Competitive with human articles in transparency and
                   auditability; humans still better in creative design
The Increment
One sentence: Before this paper, data-to-story pipelines existed only as hand-crafted workflows or single-bot experiments; after this paper, we have a reproducible, end-to-end multi-agent system that produces verifiable, interactive multimedia articles from raw data.
Core Mechanism
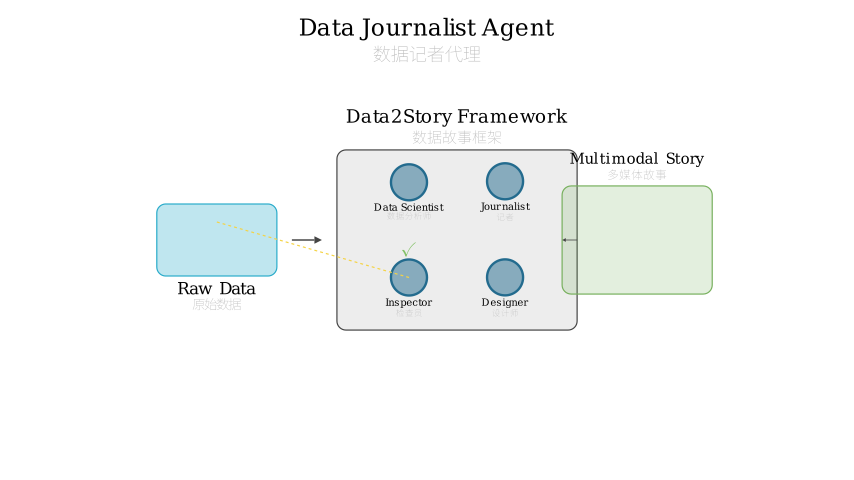
Data2Story operates like a miniature newsroom assembly line. The core is a set of agents with distinct roles: Data Explorer (analyzes raw data, suggests statistics, proposes angles), Stitcher (weaves statistics into a coherent narrative outline), Inspector (checks every factual claim against source data, code, or external references – this is the novelty), Designer (chooses the best multimodal format – map, chart, audio, video – based on narrative needs), and Composer (assembles the final HTML article). Data flows: raw CSV/JSON → Data Explorer proposes angles and statistics → Stitcher drafts story → Inspector verifies (returns to Stitcher if gaps found) → Designer selects visuals and generates assets → Composer finalizes HTML. The Inspector is a rule-based + LLM hybrid: it extracts claims, converts them to executable code, runs the code against the data, and checks if the result matches the claim. If not, the claim is flagged and revised.
            +------------+     +------------+     +-----------+
            |  Raw Data  | --> |  Explorer  | --> |  Stitcher |
            | (CSV/JSON) |     | (angles,   |     | (narrative|
            +------------+     |  stats)    |     |  outline) |
                                +------------+     +-----------+
                                                      |
                                                      v
            +------------+     +------------+     +-----------+
            |  Composer  | <-- |  Designer  | <-- | Inspector |
            | (final     |     | (multimodal|     | (verify   |
            |  HTML)     |     |  assets)   |     |  claims)  |
            +------------+     +------------+     +-----------+
                                                      |
                                                      v
                                            +------------+
                                            |  Re-run    |
                                            |  code vs   |
                                            |  data      |
                                            +------------+
Structural metaphor: Think of the system as a Michelin-star kitchen kitchen team. The Data Explorer is the sous-chef who reads the pantry (raw data) and proposes three possible dishes (angles). The Stitcher is the executive chef who writes the recipe (narrative outline). The Inspector is the quality-control taster who takes a bite of every component, checks the ingredient list (data source), and insists on re-cooking anything that tastes off (claim not matching data). The Designer is the plating artist who chooses the right plate (map, chart, audio) based on the dish’s flavor profile. The Composer is the expeditor who assembles the final plate (HTML article). The crucial innovation is the QC taster – without it, any claim could be fluff. In existing systems, the chef might say “sales increased 30%”, but no one verifies it against the spreadsheet. Here, the taster runs a little script to confirm that indeed, revenue in Q4 is 30% higher than Q3.
Key Concepts
-
Claim Inspector: The heart of verifiability. An Inspector takes a claim like “Life expectancy in Japan is 84 years”, extracts the entity (Japan) and metric (life expectancy), queries a knowledge base or executes a code snippet against the source data (e.g.,
df[df.country == 'Japan'].life_expectancy.mean()), and checks if the result is within a tolerance. If the claim passes, it gets a green badge; if not, the Stitcher revises it. This is not just fact-checking after writing – it’s built into the generation loop. -
Multimodal Reasoning: Instead of always generating a static bar chart, the Designer agent reasons about which modality best tells the story. For geographic data it picks an interactive map (using Folium/Leaflet); for time series it picks an animated line chart; for music-related data it generates an audio snippet via a music generation model (e.g., MusicGen). This is a design choice: the agent has a toolbox of possible outputs and selects based on heuristic rules (e.g., “lat/lon columns present → interactive map”).
-
Virtual Newsroom Orchestration: The agents run in sequence, but with a feedback loop. The Inspector sends failures back to the Stitcher, which revises the narrative. This iterative refinement is what enables the system to converge to a factually grounded story. The orchestrator (a central LLM) tracks conversation state and decides when to move to the next stage. It’s not truly concurrent – more like a call-and-response pipeline.
Framework Shift
Before (mainstream approach):
   Data -> Single LLM -> Text + Static chart (e.g., ChatGPT + Matplotlib)
   Issue: claims not verified, visuals generic, no interactivity

           +--------+       +-------+
           |  Data  | ----> |  LLM  | ----> Text + static chart
           +--------+       +-------+
                                |
                           (no verification)

After (this paper):
   Data -> Multi-agent pipeline with Inspector loop -> Interactive HTML
   Claims are verified by code execution, visuals are chosen per modality

           +--------+       +-----------+       +---------+
           |  Data  | ----> | Explorer + | ----> |  Design |
           +--------+       | Stitcher  |       |  agent  |
                            | Inspector |       +---------+
                            |  (loop)   |             |
                            +-----------+             v
                                      +--------+  +----------+
                                      | Compose |  | Interactive|
                                      |  agent  |  | HTML      |
                                      +--------+  +----------+
From a single monolithic LLM generating text+static chart to a multi-agent system with built-in verification and multimodal asset selection, the core shift is from generation without accountability to generation with auditability.
Expert Assessment
Problem choice: Real and timely. Data journalists spend weeks on individual stories, and the demand for data-driven reporting is growing. The gap is genuine – existing tools either do analysis or design, not both with verification.
Method maturity: Clever insight (Inspector as a feedback loop) but somewhat brute-force in implementation (uses standard LLM agents, engineering effort rather than algorithmic novelty). Simpler approaches – like a single LLM with a fact-checking API call – could cover some ground, but the Inspector’s code-execution loop is more thorough.
Experimental integrity: Decent. 18 articles from real news outlets (NYT, WSJ, etc.) paired with original pieces, three human evaluators for angle coverage, 53 participants for rubric scoring. Baselines are fair (single LLM baseline, ablated versions). One red flag: the “proxy judge” using GPT as a reader to simulate navigation cost is interesting but not validated against real user behavior – it’s a cost-saving proxy, but the paper admits it’s an approximation. Overall numbers look solid.
Writing quality: The abstract and introduction are crisp. The Related Work section is thin – they survey each domain but don’t synthesize well. The Method section is clear, but the evaluation details could be trimmed; the paper would benefit from a tighter experimental section and a more thorough discussion of failure cases (e.g., when does the inspector false-positive? How many revision cycles?).
Verdict: weak accept — The verifiability loop and multimodal reasoning are genuine contributions, even if the overall architecture is engineered rather than theoretically novel. It’s worth attention for practitioners building automated journalism pipelines.
Takeaways
- Verification loop pattern: Any LLM-based system that makes factual claims should incorporate a code-execution verification step. This is immediately transferable to domains like automated scientific literature review, financial reporting, or automated medical summaries.
- Multimodal selection rules: The heuristic rules for deciding between map/chart/audio are simple but effective – you can steal these for any data-to-visual pipeline.
- Orchestration with feedback: The idea of a central orchestrator that routes failures back to the Stitcher is a clean pattern for multi-agent systems – it’s not specific to journalism.
- Cost-saving proxy evaluation: Using GPT to simulate human navigation is interesting but don’t rely on it without calibration – but as a cheap sanity check, it’s worth trying in your own projects.
论文: 2606.11176 作者: Kevin Qinghong Lin, Batu EI, Yuhong Shi, Pan Lu, Philip Torr, James Zou 分类: cs.CV, cs.CL, cs.CY, cs.HC
缺口
数据驱动的新闻业目前是碎片化的。有数据科学代理(如 Code Interpreter、AutoGen)进行统计分析和提问回答——但它们的产出是代码片段和表格,而不是连贯的叙事。另一方面,设计代理(如 WebSim、Midjourney)可以生成漂亮的静态图表或富页面,但它们不理解数据来源或编辑角度。缺失的环节是一个端到端系统,能够从原始数据出发,找到一个角度、撰写故事、生成交互式视觉内容,并且——关键——将每一个主张与来源绑定,让读者(或事实核查员)可以验证。这篇论文通过将多个专门的大语言模型代理编排成一个虚拟新闻编辑室来填补这一空白,特别强调可验证性和多模态输出。
           问题:碎片化工具,缺乏端到端数据叙事
                     |
                     v
         假设:一个代理可以取代人类新闻编辑室团队
                     |
                     v
         方法:多代理框架(Data2Story)加上检查员
                     |
                     v
      证据:18篇文章,在角度覆盖、评分评估(53名参与者)
           代理裁判(节省成本)和可验证性上进行对比
                     |
                     v
      结论:在透明度和可审计性方面与人写文章相当;
            人类在创意设计上仍有优势
增量
一句话:在这篇论文之前,数据到故事的管道只存在于手工工作流或单个机器人的实验;在这篇论文之后,我们有了一个可复制的、端到端的多代理系统,能从原始数据生成可验证的、交互式的多媒体文章。
核心机制
Data2Story 像一个微型新闻编辑室流水线一样运作。核心是几个扮演不同角色的代理:数据探索者(分析原始数据,建议统计量,提出角度)、拼接者(将统计量编织成连贯的叙事大纲)、检查员(对照源数据、代码或外部参考核实每个事实主张——这是新颖之处)、设计者(根据叙事需求选择最佳多模态格式——地图、图表、音频、视频)和编排者(组装最终的 HTML 文章)。数据流程:原始 CSV/JSON → 数据探索者提出角度和统计量 → 拼接者起草故事 → 检查员核实(如果发现缺口则返回拼接者)→ 设计者选择视觉内容并生成资产 → 编排者完成 HTML。检查员是一个规则+大语言模型的混合体:它提取出主张,将它们转换为可执行代码,在数据上运行代码,并检查结果是否与主张匹配。如果不匹配,该主张会被标记并修正。
            +------------+     +------------+     +-----------+
            |  原始数据  | --> |  探索者    | --> |  拼接者   |
            | (CSV/JSON) |     | (角度,     |     | (叙事大纲)|
            +------------+     |  统计量)   |     +-----------+
                                +------------+          |
                                                         v
            +------------+     +------------+     +-----------+
            |  编排者    | <-- |  设计者    | <-- |  检查员   |
            | (最终HTML) |     | (多模态    |     | (核实主张)|
            +------------+     |  资产)     |     +-----------+
                                +------------+          |
                                                         v
                                               +------------+
                                               |  重新运行   |
                                               |  代码 vs 数据|
                                               +------------+
核喻:把系统想象成一个米其林星级厨房团队。数据探索者是助理厨师,浏览食材仓库(原始数据)并提出三道可能的菜品(角度)。拼接者是主厨,编写食谱(叙事大纲)。检查员是质量控制试吃员,每道菜做出来他都要尝一口,检查配料表(数据来源),如果味道不对就坚持重做(主张与数据不匹配)。设计者是摆盘艺术家,根据菜品的风味(叙事需求)选择合适的盘子(地图、图表、音频)。编排者是传菜员,把最终盘子(HTML 文章)端出去。关键的创新是质控试吃员——没有他,任何主张都可能是虚胖。在现有系统中,主厨可能说”销量增长了30%“,但没人对照电子表格核实。这里,试吃员会运行一个小脚本确认第四季度的营收确实比第三季度高30%。
关键概念
-
主张检查员:可验证性的核心。检查员拿到一个主张,比如”日本的人均寿命是84岁”,提取出实体(日本)和指标(人均寿命),查询知识库或针对源数据执行一段代码(如
df[df.country == 'Japan'].life_expectancy.mean()),并检查结果是否在容忍范围内。如果主张通过了检查,它获得绿色徽章;如果不通过,拼接者会修改它。这不是写作后的核对,而是嵌入在生成循环中的。 -
多模态推理:设计者代理不会总是生成静态柱状图,而是根据不同模态哪个最擅长讲述故事来选择。对于地理数据,它选择交互式地图(使用 Folium/Leaflet);对于时间序列,选择动画折线图;对于音乐相关数据,通过音乐生成模型(如 MusicGen)生成一段音频。这是一个设计选择:代理有一个工具包可以输出不同模态,根据启发式规则选择(例如”存在经纬度列 → 交互式地图”)。
-
虚拟新闻编辑室编排:代理顺序执行,但存在反馈循环。检查员把失败传回拼接者,后者修改叙事。这种迭代优化使系统能收敛到基于事实的故事。编排者(一个中央大语言模型)跟踪对话状态并决定何时进入下一阶段。它不是真正的并发——更像是一种呼叫-应答管道。
框架转变
之前(主流方法):
   数据 -> 单个大语言模型 -> 文本 + 静态图表(例如 ChatGPT + Matplotlib)
   问题:主张未经核实,视觉内容通用,无交互

           +--------+       +-------+
           |  数据  | ----> |  LLM  | ----> 文本 + 静态图表
           +--------+       +-------+
                                |
                           (无核实)

之后(本文方法):
   数据 -> 带检查员循环的多代理管道 -> 交互式 HTML
   主张通过代码执行核实,视觉内容按模态选择

           +--------+       +-----------+       +---------+
           |  数据  | ----> | 探索者 +  | ----> |  设计   |
           +--------+       | 拼接者    |       |  代理   |
                            | 检查员    |       +---------+
                            |  (循环)   |             |
                            +-----------+             v
                                      +--------+  +----------+
                                      | 编排器  |  | 交互式   |
                                      |  代理   |  | HTML     |
                                      +--------+  +----------+
从单个庞大语言模型生成文本+静态图表,到具有内置核实和多模态资产选择的多代理系统,核心转变是从无问责的生成转向有可审计性的生成。
专家评审
选题眼光:真实且及时的。数据新闻工作者往往需要数周时间完成一篇报道,而数据驱动的新闻报道需求在不断增长。这个缺口是真实的——现有工具要么做分析要么做设计,没有两者兼备且包含核查的。
方法成熟度:检查员作为反馈循环的想法是巧妙的,但实现上有些蛮力(使用标准大语言模型代理,更多是工程努力而非算法创新)。更简单的方法——比如单个大语言模型加一个事实核查 API 调用——也能覆盖部分范围,但检查员的代码执行循环更彻底。
实验诚意:不错。他们从真实新闻媒体(纽约时报、华尔街日报等)选取了18篇文章并与原文配对,三位人类评估者进行角度覆盖评价,53名参与者进行评分评估。基线设置公平(单个 LLM 基线、消融版本)。一个值得警惕的点:用 GPT 作为代理读者来模拟导航成本,这个 “代理裁判” 很有趣但未经真实用户行为验证 —— 它只是一个节省成本的近似,论文也承认了这一点。总体数字是扎实的。
写作功力:摘要和引言写得干净利落。相关工作部分比较单薄——他们逐一调查了各个领域但没有很好地综合。方法部分清晰,但实验细节可以缩减;论文如果能删减实验部分、增加对失败案例的讨论(例如检查员何时会假阳性?需要多少轮修订?),会提升一个档次。
判决:弱接收 — 可验证循环和多模态推理是真正的贡献,尽管整体架构是工程性而非理论性创新。对于构建自动化新闻管道的实践者来说,值得关注。
要点总结
- 验证循环模式:任何基于大语言模型的系统,如果会做出事实主张,都应该引入代码执行的验证步骤。这一点可以直接迁移到自动化科学文献综述、财务报告或自动医学摘要等场景。
- 多模态选择规则:用于判断使用地图/图表/音频的启发式规则简单但有效——你可以直接在数据到视觉的管道中借用。
- 带反馈的编排:中央编排器将失败传回拼接者的模式是一个干净的多代理系统设计——不仅限于新闻业。
- 代理裁判评估:用 GPT 模拟人类导航很有趣,但未经校准不能依赖——不过作为成本低廉的合理性检查,值得在自己的项目中试一试。