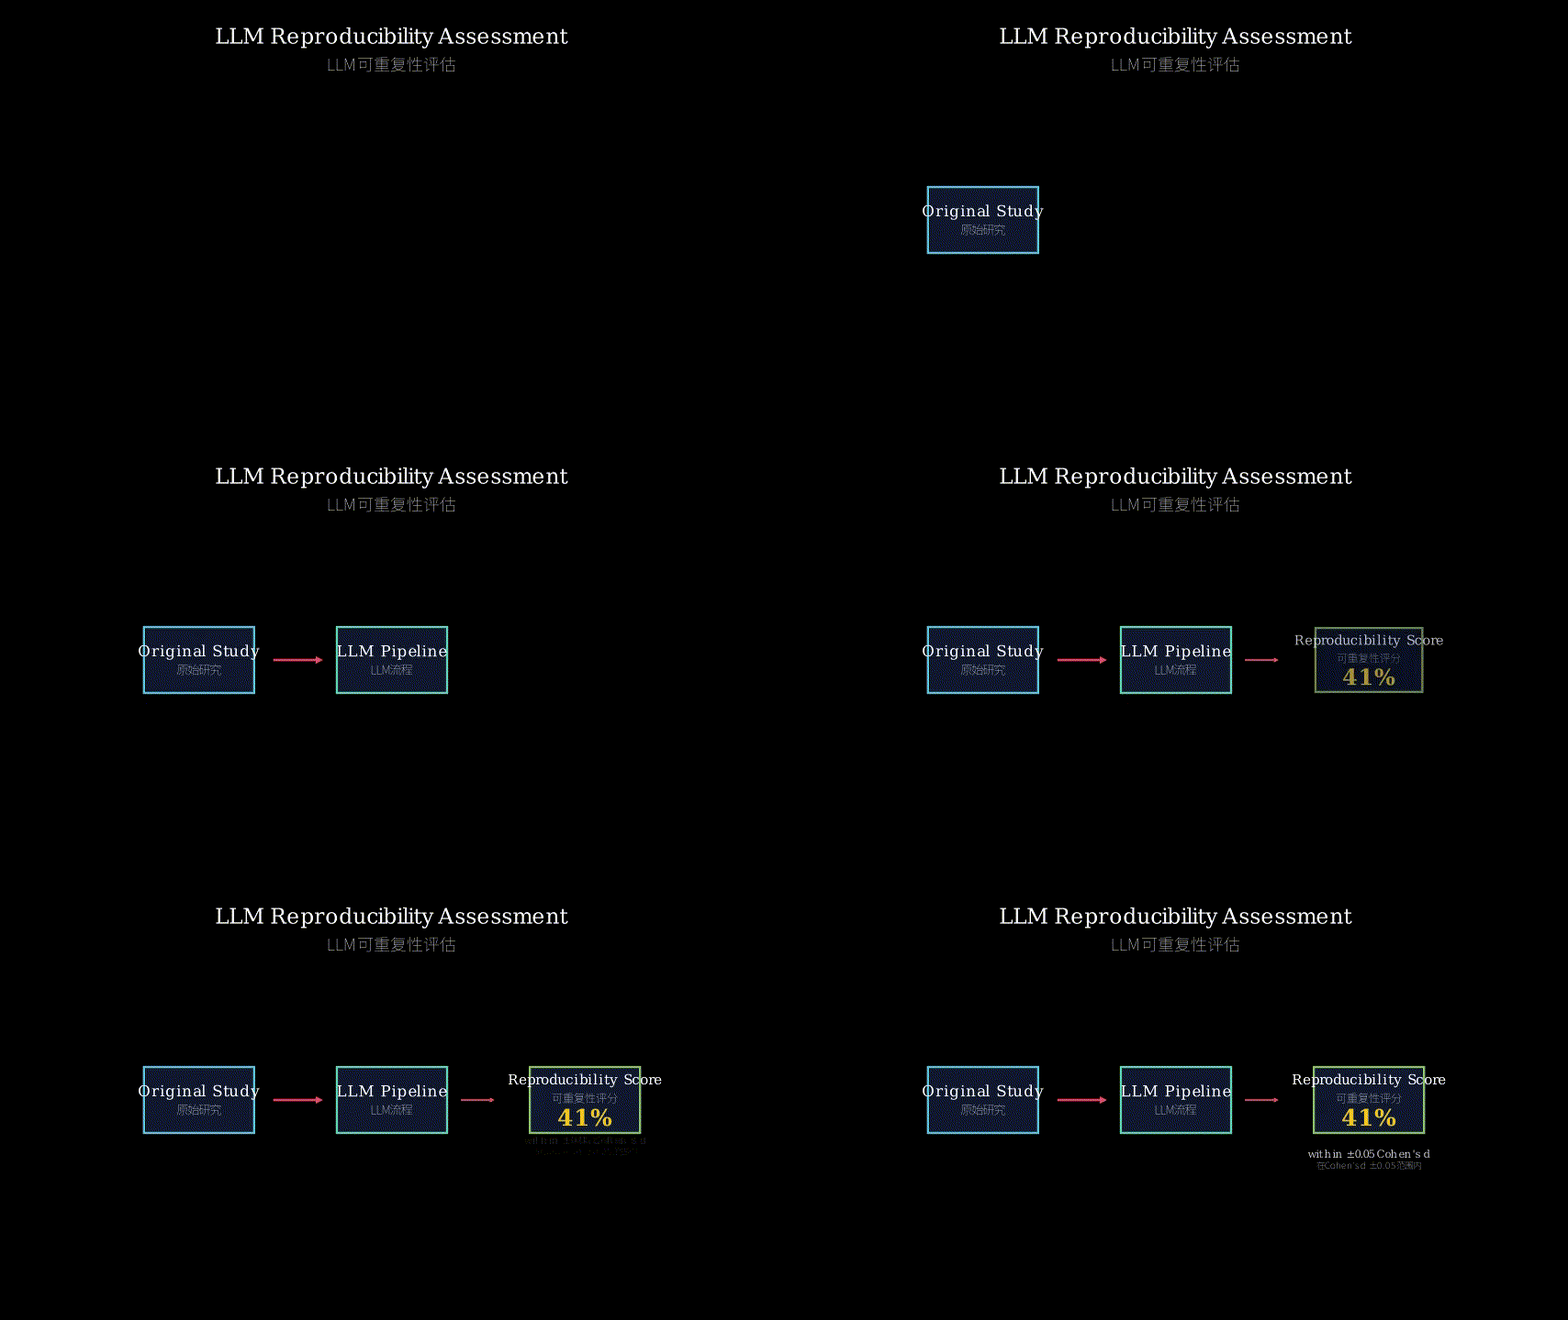
Paper: 2606.13670 Authors: Tobias Holtdirk, Pietro Marcolongo, Anna Steinberg Schulten, Felix Henninger, Stefan Rose, Sarah Ball, Bolei Ma, Frauke Kreuter, Markus Weinmann, Stefan Feuerriegel Categories: cs.AI
The Gap
Reproducibility in the social sciences has traditionally been evaluated by hiring independent researchers to reanalyse original data and check whether published findings hold. This approach works, but it’s painfully slow and expensive – each assessment requires weeks of human effort, domain expertise, and coordination with data curators. As a result, only a tiny fraction of published studies ever get audited, and systematic large-scale checks remain infeasible.
The paper sits at the boundary where reproducibility assessment meets automation. Prior work has attempted rule-based checks (can’t handle diverse study designs) and crowdsourced reanalysis (still human-intensive). The logical next step is to ask whether a language model that can read study descriptions, understand statistical procedures, and generate analysis code can replace the human reanalyst entirely.
[Problem: Reproducibility audits are manual, slow, and unscalable]
       |
       v
[Hypothesis: A large language model can automate the full reanalysis pipeline]
       |
       v
[Method: Feed study description (hypothesis, data, analysis plan) into LLM -> generate executable R/Python code -> compute effect size]
       |
       v
[Evidence: Test on N=76 published studies with predefined claims; compare against original results and human reanalyses]
       |
       v
[Conclusion: LLM pipeline reproduces original qualitative conclusions 96% of the time, outperforming human reanalysts (74%); effect size recovery within +/- 0.05 Cohen's d in 41% of studies]
The Increment
One sentence: Before this paper, reproducibility assessment required a human to reanalyse data – now a language model can do it automatically, opening the door to systematic auditing at scale.
Core Mechanism
The pipeline has four components. First, a study description is constructed from the original paper’s key elements: the research question, the experimental design, the variables and sample, and the exact statistical analysis reported. This description is fed into a carefully engineered prompt that instructs the LLM to act as a “reanalysis scientist”.
Second, the LLM generates analysis code (R or Python) that mirrors the original study’s procedure as closely as possible – running the same t-test, regression, or ANOVA on the same data. The prompt includes constraints like “preserve the original analytical choices” and “output the effect size (Cohen’s d) with a 95% confidence interval”.
Third, the code is executed in a sandboxed environment on the original dataset. The LLM doesn’t see the code once it’s generated; execution is done by a separate runner that captures output and errors. If the code fails, the pipeline logs a failure (7 out of 76 studies did).
Fourth, the computed effect size is compared against the original published effect size. If the absolute difference in Cohen’s d is <= 0.05, it’s a “quantitative recovery”. Separately, the pipeline reads the LLM-generated result and classifies whether it “supports the original claim” (qualitative conclusion). This dichotomous judgement is compared against the original study’s conclusion.
+----------------------------+
| Study description:         |
|  - research question       |
|  - hypothesis              |
|  - data description        |
|  - analysis plan           |
+----------------------------+
          |
          v
+----------------------------+
| LLM prompt (engineered)    |
| "Reanalyse this study."    |
| "Generate R code to       |
|  reproduce the analysis."   |
+----------------------------+
          |
          v
+----------------------------+
| Generated code (R/Python)  |
| + sandboxed execution      |
| + error handling           |
+----------------------------+
          |
          v
+----------------------------+
| Extracted effect size: d   |
| + qualitative conclusion:  |
|   does result support      |
|   the original claim?      |
+----------------------------+
          |
          v
+----------------------------+
| Compare to original:         |
|  - quantitative:              |
|    delta(d) <= 0.05?         |
|  - qualitative:               |
|    same binary verdict?       |
+----------------------------+
Structural metaphor: Think of this pipeline as a recipe replication robot in a test kitchen.
- The original study is the famous chef’s recipe card: ingredients (variables), steps (statistical tests), and final taste profile (effect size).
- The study description is a cleaned-up summary of the recipe, handed to the robot.
- The LLM is a robot chef that reads the description and writes a cooking program (analysis code).
- The sandbox execution is the robot actually cooking the dish using the exact same ingredients (data).
- The effect size is the taste score measured by a standardized scale (Cohen’s d).
- The human reanalyst is a second human chef who also tries to replicate the dish by hand, but is slower, more expensive, and sometimes misinterprets the recipe.
- The tolerance of +/-0.05 is like saying “if the taste score is within 1% of the original, we call it a perfect replication”.
- The qualitative conclusion is a simpler judgement: “does the dish still taste sweet?” rather than “exactly how many grams of sugar did the original chef use?”.
The robot chef (LLM) does surprisingly well — it gets the taste qualitatively right 96% of the time, outperforming the human chef (74%). But it only nails the exact sugar amount (effect size) in 41% of dishes (vs 34% for humans). So it’s better at the big picture than the fine detail.
Key Concepts
-
Effect size (Cohen’s d): A standardized measure of the magnitude of an effect. If a treatment group has a mean 0.5 standard deviations higher than the control group, Cohen’s d = 0.5. It’s independent of sample size, so it tells you how “big” the effect is, not just “is it statistically significant”. In this paper, they use d because it’s the most common metric in social science. They set a strict tolerance of +/-0.05 — that’s a narrow window, so 41% recovery is actually non-trivial.
-
Quantitative vs qualitative reproducibility: Quantitative means the exact numbers match within a tolerance. Qualitative means the *direction and significance match — e.g., both original and reanalysis say “the intervention significantly increased performance”. The authors correctly treat these as separate dimensions. A paper can be qualitatively reproducible but not quantitatively (if effect sizes differ by more than 0.05 but both say “positive effect”).
-
LLM prompt engineering: The trick is not just asking the LLM to “reanalyse this study”. The authors craft a multi-part prompt that includes: (1) the exact research hypothesis, (2) the dataset structure (variables, sample size), (3) the analysis plan as described in the original paper, (4) instructions to output code that computes Cohen’s d, and (5) a constraint to “not modify the analytical procedure”. This reduces hallucination and encourages faithful reproduction.
Framework Shift
Before (human reanalysis):                 After (LLM pipeline):

[Original study]                           [Original study]
       |                                         |
       v                                         v
[Recruit domain expert]                    [Extract study description]
       |                                         |
       v                                         v
[Human reads paper,                        [LLM prompt]
 writes analysis code]                           |
       |                                         v
       v                                    [LLM generates code]
[Execute code manually,                           |
 check output]                                    v
       |                                    [Auto-execute, extract d]
       v                                           |
[Compare with original]                            v
                                     [Compare with original (auto)]
                                          |
                                          v
                                  [Scalable: 100 studies/day]
One sentence: From human-in-the-loop, slow, expensive reanalysis to LLM-in-the-loop, fast, cheap, and parallelised reproducibility assessment — the core shift is replacing expert labour with language model automation while maintaining or improving accuracy.
Expert Assessment
Problem choice: Real gap. The reproducibility crisis is well-documented, and current manual approaches are bottlenecked by human effort. An automated alternative could enable systematic audits of entire literatures, changing how we validate social science. The 76-study dataset is modest but defensible for a proof-of-concept.
Method maturity: Clever application of existing LLM capabilities, not a deep technical breakthrough. The key insight is that a well-engineered prompt can get GPT-4 or similar models to generate correct statistical code. The pipeline itself is straightforward — the novelty is in the evaluation design and the comparison against human reanalysts. Simpler approaches (e.g., rule-based extraction of reported statistics) would fail because studies vary too much. So LLMs are a reasonable choice.
Experimental integrity: Fair baselines — they compare against actual human reanalyses of these studies. The +/-0.05 tolerance is strict; one could argue it’s too narrow (many original papers might have measurement error larger than that). But they also report qualitative results, which are more important. Red flag: 7 studies were excluded because the LLM couldn’t produce a viable estimate. That’s a 9% failure rate. The authors don’t deeply analyse why these failed — likely issues with non-standard analyses, poor study descriptions, or data format problems. The human reanalysts might have also struggled with those studies, but we don’t know. Also, the qualitative agreement of 96% seems suspiciously high — could be due to ceiling effects (most social science claims are binary and the LLM might just guess “supports” most of the time). Need to see confusion matrix.
Writing quality: The abstract and method description are clear. Weakness: no discussion of computational cost (how many API calls? what model specifically? how much per study?). The code and prompts are not provided inline — relying on external repositories makes it harder to verify. The section on “failure cases” is too thin. If rewritten, I’d want a dedicated analysis of the 7 failures and a robustness test with different LLM versions.
Verdict: Weak accept — the paper validly demonstrates the concept but has enough methodological caution to avoid overselling. Has the potential to become a standard reference if followed by larger-scale studies.
Takeaways
Practitioners in any field that requires systematic reanalysis of published results (not just social science — medical trials, economics, education) can steal two things:
-
The prompt template pattern: The zero-shot prompt that says “You are a replication scientist. Given the study description below, write R code that reproduces the analysis exactly. Output the Cohen’s d and a binary conclusion.” This pattern can be adapted to any domain by swapping the statistical test and effect size metric.
-
The quantitative+qualitative evaluation framework: Don’t just check whether exact numbers match. Always report both tolerance-bound quantitative recovery and binary conclusion agreement. The latter is more robust and easier to interpret, and it’s what LLMs excel at. This dual framework can be used to benchmark any automated reanalysis system.
-
Graceful failure handling: The pipeline logs when the LLM-generated code fails to execute. That’s valuable — a real system needs to handle failure cases transparently (e.g., fallback to a human). The authors’ 9% failure rate gives a realistic baseline for system designers.
If there is nothing concrete to take? No — these are concrete, implementable patterns.
论文: 2606.13670 作者: Tobias Holtdirk, Pietro Marcolongo, Anna Steinberg Schulten, Felix Henninger, Stefan Rose, Sarah Ball, Bolei Ma, Frauke Kreuter, Markus Weinmann, Stefan Feuerriegel 分类: cs.AI
缺口
社会科学中可重复性评估的传统做法是雇佣独立研究者重新分析原始数据,检查发表的结果是否成立。这种方法虽然可靠,但极其缓慢且昂贵——每次评估需要数周的人力、领域专业知识和数据协调工作。因此,只有极小部分已发表研究受到审计,系统性的大规模检查几乎不可行。
这篇论文站在可重复性评估与自动化交叉的边界上。之前的工作尝试过基于规则的检查(无法处理多种多样的研究设计)和众包再分析(仍然需要人力)。顺理成章的问题是:一个能够阅读研究描述、理解统计流程、生成分析代码的语言模型能否完全取代人类再分析者?
[问题:可重复性审计依赖人力,慢,不可扩展]
       |
       v
[假设:大语言模型可以自动化整个再分析流程]
       |
       v
[方法:将研究描述(假设、数据、分析计划)输入LLM -> 生成可执行的R/Python代码 -> 计算效应量]
       |
       v
[证据:在76个已发表研究(含预设结论)上测试;与原始结果和人类再分析比较]
       |
       v
[结论:LLM流水线在96%的情况下得出与原始研究相同的定性结论,超过人类再分析者的74%;效应量恢复率(Cohen's d误差<=0.05)为41%]
增量
一句话:这篇论文之前,可重复性评估需要人类重新分析数据——现在语言模型可以自动完成,为系统性大规模审计打开了大门。
核心机制
流水线包含四个组件。首先,从原始论文中提取关键元素构建研究描述:研究问题、实验设计、变量与样本、以及报告的具体统计分析。这个描述被送入一个精心设计的提示词(prompt),指示LLM扮演”再分析科学家”。
其次,LLM生成分析代码(R或Python),尽可能忠实地再现原始研究的流程——对相同数据运行相同的t检验、回归或方差分析。提示词包含”保留原始分析选择”和”输出效应量(Cohen’s d)和95%置信区间”等约束。
第三,代码在沙盒环境中对原始数据集执行。LLM一旦生成代码就不再参与;执行由独立的运行器完成,捕获输出和错误。如果代码运行失败,流水线记录一次失败(76个研究中有7个如此)。
第四,计算出的效应量与原始发表的效应量进行比较。如果Cohen’s d的绝对差 <= 0.05,则视为”定量恢复”。同时,流水线读取LLM生成的结果,判断是否”支持原始主张”(定性结论)。这个二分判断与原始研究的结论进行比较。
+----------------------------+
| 研究描述:                   |
|  - 研究问题                 |
|  - 假设                     |
|  - 数据描述                 |
|  - 分析计划                 |
+----------------------------+
          |
          v
+----------------------------+
| LLM提示词(经设计)          |
| "再分析这项研究。"          |
| "生成R代码来再现分析过程。" |
+----------------------------+
          |
          v
+----------------------------+
| 生成的代码 (R/Python)       |
| + 沙盒执行                 |
| + 错误处理                 |
+----------------------------+
          |
          v
+----------------------------+
| 提取的效应量: d            |
| + 定性结论:               |
|   结果是否支持原始主张?    |
+----------------------------+
          |
          v
+----------------------------+
| 与原始结果比较:            |
|  - 定量:delta(d) <= 0.05?|
|  - 定性:二分判断一致?     |
+----------------------------+
结构性比喻:把这个流水线想象成一个食谱复制机器人在测试厨房里工作。
- 原始研究是大厨的配方卡片:原料(变量)、步骤(统计检验)、最终口味(效应量)。
- 研究描述是配方的清洁摘要,交给机器人。
- LLM是机器人厨师,阅读描述并编写烹饪程序(分析代码)。
- 沙盒执行是机器人用完全相同的原料(数据)实际做菜。
- 效应量是用标准化量表(Cohen’s d)测量的口味分数。
- 人类再分析者是另一个人类厨师,也试图用手工复制菜品,但更慢、更贵,有时会误解配方。
- +/-0.05的容差就像说”如果口味分数与原始相差1%以内,就称为完美复制”。
- 定性结论是一个更简单的判断:“这个菜吃起来还是甜的吗?“而不是”原始大厨到底用了多少克糖?”
机器人厨师(LLM)表现惊人——在96%的菜中定性判断正确,超过了人类厨师(74%)。但它只在41%的菜中精确复制了糖的克数(效应量),而人类是34%。所以它在大局方面优于细节。
关键概念
-
效应量(Cohen’s d):衡量效应大小的标准化指标。如果实验组均值比对照组高0.5个标准差,Cohen’s d = 0.5。它独立于样本量,告诉你效果”有多大”而不只是”是否统计显著”。在本论文中,他们使用d因为它是社会科学中最常用的指标。他们设置了+/-0.05的严格容差——这是一个狭窄的窗口,所以41%的恢复率实际上不容小觑。
-
定量 vs 定性可重复性:定量指精确数字在容差内匹配。定性指方向和显著性匹配——例如,原始和再分析都说”干预显著提高了成绩”。作者正确地将其视为两个维度。一篇文章可以是定性可重复但定量不可重复(如果效应量相差超过0.05但都说是”正向效应”)。
-
LLM提示工程:关键在于不是简单地问LLM”再分析这个研究”。作者构建了一个多部分提示词,包括:(1) 确切的研究假设,(2) 数据结构(变量、样本量),(3) 原始论文中描述的分析计划,(4) 输出计算Cohen’s d的代码的指令,以及(5) “不修改分析流程”的约束。这减少了幻觉,鼓励忠实再现。
框架转变
之前(人类再分析):               之后(LLM流水线):

[原始研究]                         [原始研究]
       |                                 |
       v                                 v
[聘请领域专家]                      [提取研究描述]
       |                                 |
       v                                 v
[人类阅读论文,                     [LLM提示词]
 编写分析代码]                            |
       |                                 v
       v                            [LLM生成代码]
[手动执行代码,                            |
 检查输出]                                v
       |                            [自动执行,提取d]
       v                                   |
[与原始比较]                          [自动与原始比较]
                                           |
                                           v
                                  [可扩展:每天100个研究]
一句话:从人在回路中、慢、昂贵的再分析,到LLM在回路中、快、便宜、并行的可重复性评估——核心转变是用语言模型自动化取代专家劳动,同时保持或提高准确性。
专家评审
选题眼光:真正的缺口。可重复性危机已有充分记录,当前的手动方法受制于人力瓶颈。自动化替代方案可能使对整个文献的系统审计成为可能,改变社会科学验证的方式。76个研究的数据集对于概念验证来说规模适中,可以接受。
方法成熟度:对现有LLM能力的巧妙应用,并非深度技术突破。关键洞察在于一个设计良好的提示词可以让GPT-4或类似模型生成正确的统计代码。流水线本身很直接——创新点在于评估设计以及和人类再分析者的比较。更简单的方法(如基于规则的提取报告统计量)会因为研究变异太大而失败。所以LLM是合理的选择。
实验诚意:基线公平——他们确实与这些研究的人类再分析进行了比较。+/-0.05的容差很严格;有人可能会认为太窄了(许多原始论文本身的测量误差可能大于此)。但作者也报告了定性结果,这更重要。危险信号:7个研究因为LLM无法产生可行估计而被排除,失败率9%。作者没有深入分析为什么失败——可能因为非标准分析、研究描述不清晰或数据格式问题。人类再分析者可能也在这些研究上遇到困难,但我们不知道。此外,96%的定性一致性看起来高得可疑——可能是天花板效应(大多数社会科学主张是二分判断,LLM可能大多数时候猜测”支持”)。需要看混淆矩阵。
写作功力:摘要和方法描述清晰。弱点:没有讨论计算成本(多少次API调用?具体什么模型?每个研究多少费用?)。代码和提示词没有在线内联提供——依赖外部仓库使验证困难。关于”失败案例”的章节太单薄。如果要重写,我希望有专门的7个失败案例分析以及不同LLM版本的稳健性测试。
判决:弱接收——论文有效证明了概念,但方法上足够谨慎,避免了过度宣传。如果后续有更大规模的研究补充,有可能成为标准参考文献。
要点总结
任何需要系统性重新分析已发表结果的领域(不仅是社会科学——医学试验、经济学、教育学)的实践者可以偷师两样东西:
-
提示模板模式:零样本提示词说”你是一个再分析科学家。根据下面的研究描述,编写精确再现分析过程的R代码。输出Cohen’s d和二分结论。“这个模式可以通过替换统计检验和效应量指标来适配任何领域。
-
定量+定性评估框架:不要只检查精确数字是否匹配。始终同时报告容差限定的定量恢复率和二分结论一致率。后者更稳健、更容易解释,也是LLM擅长的地方。这个双重框架可以用来基准测试任何自动化再分析系统。
-
优雅的失败处理:流水线记录LLM生成的代码无法执行的情况。这很有价值——一个真实的系统需要透明地处理失败情况(例如回退到人工)。作者9%的失败率为系统设计师提供了一个现实基准。
如果没有具体可取之处?不——这些都是具体、可实施的模式。